BBBY
Investment Notes
Please see Disclaimer at bottom of this page!
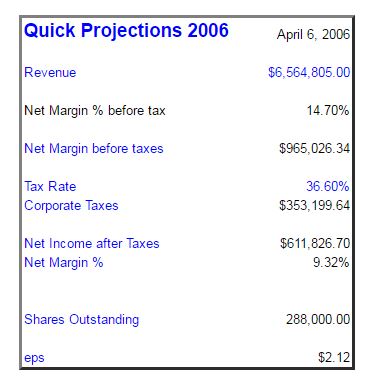
April 6, 2006 Glad we are no longer short
Earnings came out yesterday for BBBY. They were quite positive. I am thankful we covered our short position in February. Share count is expected to be 288M at 53 week year end 2/07. I ran several quick analysis like the one below, and not a heck of a lot has changed. If I am not mistaken, book value is reduced from below, to $7.86 per share. I have not dug deep into this. I suspect the lower book value is a result of stock buy-backs. I could be wrong. If you are reading this, please understand that BBBY is not a focus, and much of what I write here is merely for my possible future references.
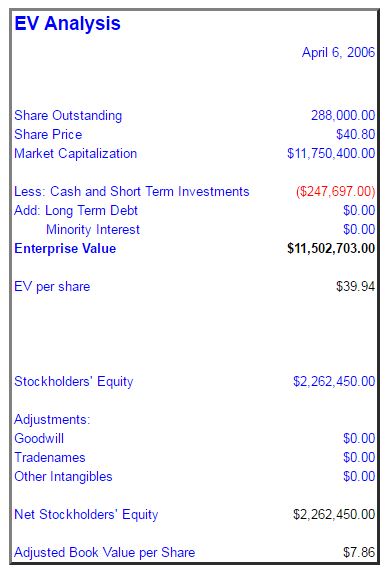
The 10K when filed will give greater info.
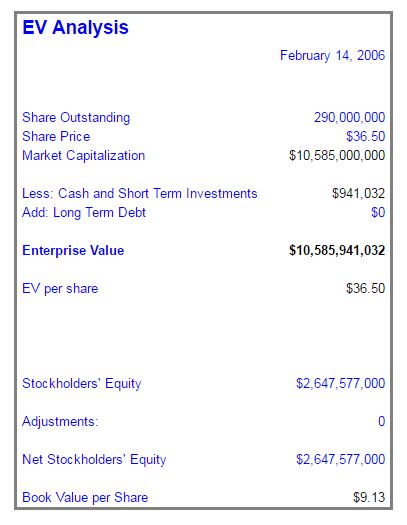
February 14, 2006 Some Valuation Adjustments
1. I was working with valuations over the last few days. I am beginning to think that my BBBY concerns are not as great as my fear of a rising stock price. That is always the possibility when short selling. I used some bad case scenarios below, and annualized return using these scenarios were still in excess of 6% in 15 years. At this point, I will begin to eliminate our short position. Part of my thinking is that there will be problems in the industry, and that the company may be aggressive on capitalization of assets. Perhaps this is the reason for low inventory turns. Nevertheless, management seems relatively honest and those paranoid concerns have not overridden my desire to cover our short position.
I successfully eliminated our short position at 36.48
| FV of current equity and future earnings | 14-Feb-06 |
|---|---|
| Tangible Book Value | $2,647,577 |
| Net Profit | $597,775 |
| Growth Rate of Net Profit for 10N | 7.00% |
| Growth Rate of Net Profit after 10N through 15N | 2.50% |
| FV of Net Profit in 10N | $1,175,915 |
| FV of Net Profit in 15N | $1,330,439 |
| FV of tangible book value plus Net Profits for 10N | $13,467,317 |
| FV of tangible book value plus Net Profits for years 11 – 15N | $21,418,026 |
| Current Enterprise Value | $11,526,032 |
| FV of tangible book value plus Net Profits for 10N | ($13,467,317) |
| Years | 10 |
| ROI on tangible book value plus Net Profits for 10N | 1.57% |
| FV of tangible book value plus Net Profits for 10N | $13,467,317 |
| FV of tangible book value multiplier | 2.50 |
| FV of Tangible Book Value using BV multiplier in year 10 | $33,668,292 |
| Current Enterprise Value | $11,526,032 |
| FV of tangible book value plus Net Profits for years 11 – 15N | ($21,418,026.38) |
| Years | 15 |
| ROI on tangible book value plus Net Profits for 15N | 4.22% |
| FV of tangible book value plus Net Profits for 15N | $21,418,026 |
| FV of tangible book value multiplier | 2.50 |
| FV of Tangible Book Value using BV multiplier in year 15 | $53,545,066 |
| Potential Future EV using BV multiplier above | |
| Current Enterprise Value | $11,526,032 |
| FV of Tangible Book Value using BV multiplier in year 10 | ($33,668,292) |
| Years | 10 |
| ROI on FV of Tangible Book Value using BV multiplier in year 10 | 11.32% |
| Current Enterprise Value | $11,526,032 |
| FV of Tangible Book Value using BV multiplier in year 15 | ($53,545,066) |
| Years | 15 |
| ROI on FV of Tangible Book Value using BV multiplier in year 15 | 10.78% |
| Sanity Checks: | |
| P/E in future | |
| FV of Net Profit in 15N | $1,330,439 |
| P/E estimate | 10.00 |
| Market Cap on above | -$13,304,394 |
| Years | 15 |
| Current Enterprise Value | $11,526,032 |
| ROI in 15N using above | 0.96% |
| Potential Revenue Growth | |
| Current Revenues | $6,415,000 |
| Growth Rate of Revenues for 10N | 7.00% |
| Growth Rate of Revenues after 10N through 15N | 2.50% |
| FV of Revenues in 10N | ($12,619,276) |
| FV of Revenues in 15N | $14,277,552 |
| FV of Revenues in 15N | $14,277,552 |
| Revenue Multiplier based on Al Meyer Rule of Thumb net margins | 2 |
| Possible Market Cap year 15 | ($28,555,105) |
| Years | 15 |
| Current Enterprise Value | $11,526,032 |
| ROI in 15N using above | 6% |
February 10, 2006 Some notes on 2/10/06 Value Line.
1. Lowered Timeliness rating to 2 on 12/30/05, and lowered Technical to 4 on 2/3/06. Big deal, I never look at that stuff anyway.
2. Projects the following for F2006
| Revenues | $6,415M |
| eps | $2.15 |
| Shares o/s | 290M |
| dividends | $0.10 |
| Cash Flow per share | $2.60 |
| Book Value per share | 10.35 (intangible of $0.50) |
| Gross Margin | 44.5% |
| Net margin | 10.10% |
| ROE | 21.50% |
| Projected eps and book value growth rates | 16.50% |
3. Extrapolating some value from above. This should not be relied upon, I was merely performing some “back of the envelope” analysis. There are several ways I can extrapolate some value from the above. Keep in mind, that I find the above expectations to be on the high side of what I expect to happen. I think growth rate will be in the 12% range. I also wouldn’t be surprised to see margin pressure, perhaps bringing down earnings to $500M range. Hence, I will use 2 scenarios.
| High Scenario | Middle Scenario | Low Scenario | |
| Tangible Book Value | $2,857 | $2,857 | $2,857 |
| Net Profit | $650 | $550 | $500 |
| Growth Rate | 16.50% | 10.00% | 7% |
| Future Value of above 10N | $27,360 | 16,176 | 12,528 |
| Growth Rate after 10N | 5% | 3% | 2.5% |
| Future Value of Net Profit in 10N | 2,994 | 1,427 | 984 |
| Future Value of Net Profit in 15N | 3,821 | 1,654 | 1113 |
| Future Value of above 15N | 51,463 | 26,329 | 19,347 |
| Current Shares O/S | 300 | 300 | 300 |
| Current Share Price | 36 | 36 | 36 |
| Current Market Cap (PV starting) | 10,800 | 10,800 | 10,800 |
| PV from Above | 10,800 | 10,800 | 10,800 |
| FV 10N from above | 27,360 | 16,176 | 12,528 |
| Years | 10 | 10 | 10 |
| ROI on above | 9.74% | 4.12% | 1.50% |
| PV from Above | 10,800 | 10,800 | 10,800 |
| FV from 15N above | 51,463 | 26,329 | 19,347 |
| Years | 15 | 15 | 15 |
| ROI on Above | 10.97% | 6.12% | 3.96% |
| Alternate Method (Sanity Check) | |||
| Future Value of eps in 15N | 3,821 | 1,654 | 1,113 |
| P/E estimate | 20 | 13 | 10 |
| Market Cap (FV* future P/E) | $76,420 | 21,502 | 11,130 |
| Years | 15 | 15 | 15 |
| Current Market Cap | 10,800 | 10,800 | 10,800 |
| ROI imputed | 13.94% | 4.70% | 0.20% |
I revisited some of my reasons for entering the short, be it , at a price around $41.58. Let me list them again, and then comment.
1. Inventory turns – These remain a concern for me. Scan below, see concerns, and at the same time consistency by BBBY. Metrics recently had difficulty, but that could be a short term movement that has no bearing on companies continued operations.
2. cooling housing market – still a thesis.
3. earnings management? – perhaps buyback is based on meeting eps. Perhaps eps will be up and net income down, due to reduced share count. Just speculation, and not a great emphasis in my short thesis. Management has always been honest and excellent, but again, the skeptical part of me thinks the possibility of expenses being capitalized.
4. consumer retrenchment – I still believe that American consumer will have a revolutionary shift from drunken spenders to massive savers.
So, what does the above tell me? Not a gosh darn thing. Of course if the high scenario works, I do not want to be short, and would even consider a long. Yet, I hardly expect the high side scenario to occur. As I dwell on this, the reality is, that I really don’t expect the middle scenario to occur. Going out 10 or 15 years is semi-absurd. Yet, it does build a road map. My gut is thinking that history will show us a level between “medium and low expectations.” If that were to happen, it looks like annual ROI would be in the area of 3 to 5%. For now, I remain short.
It will be interesting to see what share buyback does to cash balance.
January 6, 2006 Some notes and follow-ups (35.24)
1. I spoke with BBBY about my concerns on inventory turnover and potential outside manufacturing, guarantors, etc. I previously discussed this on December 23, 2005 . The following are notes I took during our discussion.
A. The premise of BBBY business and model is for customer service and readily available inventory. BBBY claims that the inventory turns will be reduced with this type of strategy. Again, I reiterate that turns under 2.70 have been historically common for BBBY (at least since 1999).
B. Under no circumstances does BBBY, CTS or Harmon guarantee any debt for entities that manufacture for BBBY. I asked if there were any minimum guarantee purchases by BBBY from these manufacturers over a long period of time. BBBY mentioned on several occasions that purchase guarantee obligations are typically on an order by order basis. They claimed that typically, but not always, the guarantee obligations are short term in nature and never exceed a long period of time. They stated that under no circumstances are they affiliated with the manufacturer, they do not act as guarantors of any manner to the manufacturers creditors and in all cases the manufacturer also supplies other customers which are not affiliated with BBBY.
C. I asked BBBY why they used to mention an $80B home goods market, and now mention a $100B home goods market. BBBY claimed that this is a Wall Street number, and they are merely repeating such a number. This sounded odd to me, yet not that big a deal. If you read the conference call transcripts, you will see that BBBY clearly uses this metric and does not indicate that the number is a “wall street number.”
D. I asked about the recent change of Ron Curwin from CFO to Investor relations. I asked if Mr. Curwin was cool with the change. IR was very clear in mentioning that Mr. Curwin was very happy with the change. They mentioned that he is 75 years old, and wants to focus elsewhere. I was cool with that response.
E. I asked about the change in “Other Current Assets”, which increased from $93.5M on February 26, 2005 to $147.6M on November 26, 2005. IR said they weren’t sure and would get back to me. I have not examined this in detail. Could just be a typical pre-paid, or it could be the beginning of a future recognized expense. The difference is $54.1M or $0.16 per share. As I look at 10Q for 8/27/05, I noticed that the big change occurred this quarter. “Other Current Assets” increased by $33.3M this quarter. Something to keep an eye on for quality of earnings analysis. This is not necessarily a problem, just something to look at. It could be a seasonal issue.
IR did get back to me on the “Other Current Assets”, they mentioned it was seasonal and mostly prepaid advertising. I would really have to analyze going back to this period each year to verify that statement. I trust that IR response is accurate, my gut says it is. Keep in mind, this will be an expense as the costs are recognized on the Profit and Loss statement.
2. IR said that increased costs since Katrina, continue to have a “residual effect.”
3. I asked IR if their earnings guidance from December 22, 2005 , incorporated projected reduction in share buy-backs. Interestingly enough, IR mentioned that the reduction was incorporated into the guidance. Why is that interesting? The reason being, that Net Operating Income could actually go down from last year, and eps at the same time could increase because of lower share count. Isn’t accounting fun? Are you confused yet? Nahhhhhh (think sheep).
December 23, 2005 Quick Metrics (these have not been fully reviewed)
Total Quarterly Revenues
| Q1 | Q2 | Q3 | Q4 | |
|---|---|---|---|---|
| 1998 | ? | $344,946 | $363,431 | $419,249 |
| 1999 | $359,372 | $457,586 | $486,457 | $574,551 |
| 2000 | $462,735 | $597,001 | $609,519 | $746,107 |
| 2001 | $575,833 | $713,636 | $759,438 | $879,055 |
| 2002 | $776,798 | $903,044 | $936,030 | $1,049,292 |
| 2003 | $893,868 | $1,111,445 | $1,174,740 | $1,297,928 |
| 2004 | $1,100,900 | $1,274,000 | $1,305,200 | $1,467,600 |
| 2005 | $1,244,400 | $1,431,200 | $1,448,680 | $1,650,000E |
% Change in Quarterly Revenues From Year Ago Quarter
| Q1 | Q2 | Q3 | Q4 | |
|---|---|---|---|---|
| 1999 | ? | 32.65% | 33.85% | 37.04% |
| 2000 | 28.76% | 30.47% | 25.30% | 29.86% |
| 2001 | 24.44% | 19.54% | 24.60% | 17.82% |
| 2002 | 34.90% | 26.54% | 23.25% | 19.37% |
| 2003 | 15.07% | 23.08% | 25.50% | 23.70% |
| 2004 | 23.16% | 14.63% | 11.11% | 13.07% |
| 2005 | 13.03% | 12.34% | 10.99% | 12.43%e |
Total Annual Revenues
| Fiscal Year | |
|---|---|
| 1999 | $1,877,966 |
| 2000 | $2,396,655 |
| 2001 | $2,927,962 |
| 2002 | $3,665,164 |
| 2003 | $4,447,981 |
| 2004 | $5,147,700 |
| 2005 | $5,900,000 est |
| 2006 | $6,600,000 est |
% Change in Total Annual Revenues
| Fiscal Year | |
|---|---|
| 1999 | 34.4 |
| 2000 | 27.62% |
| 2001 | 22.17% |
| 2002 | 25.18% |
| 2003 | 21.36% |
| 2004 | 15.73% |
| 2005 | 14.61% est |
| 2006 | 11.86% est |
Inventory
| Q1 | Q2 | Q3 | Q4 | |
|---|---|---|---|---|
| 1998 | 342,525 | 401,749 | 360,337 | |
| 1999 | 415,076 | 439,535 | 522,433 | 470,433 |
| 2000 | 548,018 | 594,602 | 687,143 | 606,704 |
| 2001 | 696,896 | 733,157 | 849,238 | 753,972 |
| 2002 | 850,041 | 859,891 | 989,074 | 915,671 |
| 2003 | 926,906 | 958,778 | 1,167,808 | 1,012,334 |
| 2004 | 1,065,500 | 1,052,800 | 1,213,800 | 1,152,000 |
| 2005 | 1,239,000 | 1,238,900 | 1,424,730 |
Cost of Sales
| Q1 | Q2 | Q3 | Q4 | |
|---|---|---|---|---|
| 1998 | 203,003 | 214,958 | 243,719 | |
| 1999 | 213,158 | 272,016 | 289,673 | 336,263 |
| 2000 | 275,389 | 355,502 | 363,452 | 434,305 |
| 2001 | 340,874 | 422,294 | 448,408 | 508,820 |
| 2002 | 458,436 | 532,709 | 549,806 | 605,666 |
| 2003 | 526,688 | 652,300 | 687,753 | 734,576 |
| 2004 | 644,100 | 743,100 | 757,000 | 817,100 |
| 2005 | 723,600 | 829,400 | 833,317 |
Inventory Turns
| Q1 | Q2 | Q3 | Q4 | |
|---|---|---|---|---|
| 1998 | ? | ? | ? | 2.70 |
| 1999 | 2.30 | 2.34 | 2.35 | 2.41 |
| 2000 | 2.37 | 2.35 | 2.31 | 2.35 |
| 2001 | 2.31 | 2.29 | 2.28 | 2.27 |
| 2002 | 2.31 | 2.35 | 2.37 | 2.38 |
| 2003 | 2.40 | 2.46 | 2.49 | 2.56 |
| 2004 | 2.59 | 2.68 | 2.68 | 2.84 |
| 2005 | 2.61 | 2.67 | 2.56 |
December 23, 2005 Quick ramblings
1. Comp sales seem to be slowing down. I need to dive into this. The trend appears to be down. If (or when) the consumer retrenches, I think we could see decreasing same store comps.
2. I need to find out explanations for low inventory turnover, as well as questions as to whether BBBY has manufacturing operations or is a guarantor or part owner of any international operations.
3. Flow Ratio is (CA – Cash and ST) / (CL – STD). The desired ratio is < 1.25.
| Current Assets | 2,513,339 |
| Cash and ST Investments | $ 941,032 |
| Current Liabilities | $1,002,621 |
Flow ratio = 1.57 On the face, this looks on the high side. With that said, this really needs to be analyzed before making any interpretations.
4. Inventory has grown 17.4% from prior year, versus sales growth of 11% and square footage growth of 12%.
5. Inventory per square foot was $58.3 for 3Q05, $52.7 for 2Q05 and $55.5 for 3Q04.
6. Free Cash Flow was ($13.3M) in 3Q05 versus $24.3M in 3Q04. This is tied into the inventories. Higher inventories are increasing the margins, increasing the eps. Inventory is not turning too heavily, and could be considered to be weak turns. With that said, this could be a future warning sign.
7. Capex is increasing more than expected. The skeptical CPA in me (he comes out every so often, looks around, kicks some dirt, blows his nose, and then scrambles back into his dark hole) has me thinking that boosting capex increases eps. A lot can be hidden in the capex.
8. Square foot inventory increased 5%.
9. I recently read a sell side bullish report on BBBY. They extrapolated BBBY rent payments to be $2.2B of debt. I have such a block with that theory. I can see adding the debt, because of owning versus leasing, but I can’t figure out why one wouldn’t also impose a “hypothetical asset” to correspond with the “hypothetical debt.”
December 23, 2005 CC Notes and some comments (my comments are italicized in blue)
1. Consolidated store space at November 30, 2005 was approximately 25M square feet.
2. Quarter was challenging. Challenges included Katrina, Wilma and Rita.
3. Consolidated comp sales were up 3.1% for the 3rd quarter and 4% for the 9 months ended.
4. “The third-quarter increase primarily resulted from the de-leveraging of payroll and payroll-related items, mostly from the expensing of stock options in connection with our early adoption of the revised stock option accounting rules, and a relative increase in pre-opening and occupancy expenses, which I said earlier, was partially offset by the settlement of credit card litigation and certain insurance recoveries from prior year events.” ( I highlighted to determine if I could trace recurring situations. If an overall expense, won’t occur again, if a net benefit, won’t occur again.)
5. ” Our balance sheet at November 26 was solid and our operating cash flow was strong.” I need to dive into the 10Q when available. I haven’t analyzed cash flows, but for some reason, my gut reaction is that it was weaker than expected, and maybe even weak, without relation to expectations. I need to compare against other 3rd quarters.
6. “we remain comfortable with our ability to meet our performance and growth targets for fiscal 2005, which ends on February 25th, and we are expecting another productive year in fiscal 2006.”
7. Remains comfortable with 4Q05 $0.64 eps target, and full year eps of $1.89.
8. Additional 4th Quarter planning assumptions:
a. expect to be operating 743 BBBY stores, 29 CTS and 38 Harmon Stores, occupying 25.5M square feet. This would include 83 new BBBY stores for F2005. About 8 or 9 stores will be opened in Feb 2007.
b. Consolidated net sales expected to grow 11 – 13%. Consolidated comp sales expected to grow 3 – 5%. New store sales for BBBY expected to be $165 -$180 per square foot in the first 12 months of operation.
c. increase in interest income because of higher rates. I need to look closely at that. I need to compare operational income, and not include interest income for comparable periods. The full year eps target of $1.89 is benefited from interest income. I certainly need to adjust valuation possibilities for this interest.
d. income tax rate unchanged at 37.4%
e. Capex for all of F2005 estimated at $285M. Depreciation estimated at $110M
9. F2006 guidance (3/7/07)
a. Consolidated net sales expected to increase 11 – 12%.
b. Incremental stock option compensation expense expected to increase through 2Q06.
c. eps expectations for 1Q06 $0.34 and 2Q06 $0.51. Interesting, in the same time period, Value Line in their 11/11/05 issue expected $0.40 and $0.57 respectively. This is a 13% reduction in earnings estimates.
d. 2nd half of F2006 will include add a week and F2006 will have 53 weeks. Extra week will be in 4Q06. 2nd half eps expected to grow by 13% to 14%. I think the climate is way too cloudy for guidance on that. I would not be surprised to see downward changes to that during the coming year.
e. number of new BBBY stores in the low 80’s. Approximately 1/3 of those in first half of F2006.
f. Consolidated comp sales expected to increase 3 – 5%.
g. Potential exists for 37.4% tax rate to come down. If this were to happen, it would increase eps.
10. ” Cash and investment securities approximated $1.35 billion, about $46 million higher than last year. This is even after our share repurchase of $350 million in last year’s final quarter.” I need to re-examine this and verify. How about insider sales in same period?
11. “Merchandise inventories levels for the ongoing Holiday season were planned to fully support our sales goals for the period. Merchandise inventories at November 26, 2005 were on plan at approximately $1.425 billion compared with approximately $1.214 billion a year ago. On a per square foot basis, inventories at the end of the fiscal third quarter were about $56.98 per square foot compared with $54.29 per square foot a year ago, a planned increase of just under 5%. Inventories continue to be tailored by store to meet the anticipated demands of the customers of each store.”
12. “capital expenditures through November 26, 2005, primarily for new store openings and Information Technology enhancements, were approximately $167.2 million compared with $112.2 million for the first three fiscal quarters a year ago. As previously stated, we now expect that capex for all of fiscal 2005 will be about $285 million. Depreciation for the nine months came to approximately $80 million, up from approximately $70 million last year and should be approximately $110 million for all of fiscal 2005.”
December 22, 2005 Quick earnings discussion
1. S&P mentions earnings miss. They discuss their earnings target of F2007 (2/06)eps being adjusted to $1.91 from $2.18. Incidentally, I noticed that Value Line projected 2.30 per share for 2007. The company has indicated 10 – 11% growth for 2007. The company in its conference call said they remain comfortable with their earnings target of $1.89 per share, previously given in September. If you take the $1.89 and apply an 11% growth rate, you have F2006 earnings of $2.10. This is a 9% reduction on earnings expectations.
2. Quick thoughts and ramblings.
a. Year to date sales up 12%, inventory up 17%. Not an automatic problem, yet something to keep your eye on.
b. Inventory turns now at 2.56X (click here). This appears to be the lowest level in 8 quarters. Again, not an automatic problem, but certainly another item to keep your eye on.
c. I need to examine cash flow closely, on the face, without any evidence other than eyeball hunches, I find it to be potentially weak.
d. Some quotes (not yet verified) from conference call… ” “quarter uniquely challenging” …”extreme promotional retail environment” … “we have chosen to remain restrained in our promotional activity”…”we remain comfortable for 2005 targets”… “”expect another productive year for 2006” … “F2006 eps estimates or models that exist, have no comments from BBBY. this will change in the future.”…
e. Net sales projected $1,486M actual was $1,449M. That looks like a miss of 2.6%. Value line projected 1550, hence a miss of 7%. Value Line used $0.46, whereas it was 0.45, a miss of 2.2%.
December 7, 2005 Some Quick thoughts and Inventory Turns.
I have been asking myself, how does BBBY do it. How are they so successful, grow their cash, grow their revenues, store base, etc etc. Yet, they only turn inventory 2.7X per year (currently). historically, 2.7X per year has been on the high side. How do they do it? how do they do it? how do they do it? how do they do it? I endlessly ponder.
As Charles Munger says, “always invert.” How could one do it? How could one do it? How could one do it? How could one do it?
Theoretically speaking, one could have a manufacturing operation overseas. have those operations make a lot of goods for you, have that operation run at a loss, and even build up debt, all at the same time, floating the inter-companies through Cost of Sales , making US public company look profitable, and overseas manufacturer look weak. If this was the case, the manufacturer could have debt, perhaps that debt is guaranteed by US public company. yet, that would have to be disclosed as an SPE (special purpose entity)?
I don’t know, just rambling and trying to make some sense. perhaps the answer is that BBBY is growing at 80 – 100 stores per year for many years, and the turns would never reflect favorably.
I still cant figure out how BBBY stays so fundamentally positive in all metrics, except for inventory turns. I cant figure it out.
The above is theoretical and hypothetical. I am not at all accusing BBBY of any type of manipulation. I am merely trying to figure out my question. Very possibly the answer to my question could be, that the turns are much higher, or that the new store growth rate is making traditional turns irrelevant.
These could be wrong, just preliminary notes. these are notes to myself.
1. look at revenue growth rates. seems to have come down from early 2000’s and before till now.
2. inventory turns at 2.73. seams low. as i looked further, fairly consistent for BBBY, even on high side. if i am not mistaken low for industry.
3. Interest income, should not be given same growth multiples as NOI. Looks like it will be $0.10 per share for fiscal 2006.
4. Inventory up 18%, whereas square footage is up 11%. check that metric.
5. metrics strong.
6. cooling housing market. already noticing less porta-potties on my long runs in central jersey. fairly affluent area, heart of BBBY consumer.
cc stuff 9/21/05
7. interesting to hear Curwin talk about home goods market at $100B, during 4Q03 CC Feinstein referred to it as $85B. Curwin claims 6% of market. search that. sounds odd.
8. margins getting hit a touch because of new payroll issues, changes in light of sfas123r (my interpretation), “lease accounting clarifications.” I have no idea what that means.
9. Depreciation to be 110 – 120m, capex at 88m in 6 months. I don’t know capex guidance for f2006. this is an area which could be used aggressively to manage eps. not accusing, just mentioning text book possibility.
10. need to look at total option overhang. i am thinking that BBBY will dilute 2 – 3% annual. tuff to say with new policy of theirs, plus the buyback, could keep dilution non existent. watch this. i see 25m shares available from 10km see page 39. this is 8%, why not use as dilution factor? should be obvious answer, that i am just overlooking right now.
11. I think i noticed same store sales increasing at 4.5%, previously 7.9%
Thesis
12. long time concerns of consumer retrenchment. i think it is coming
13. housing bubble and slowdown
14. retail shakeout. Marty Whitman today said that in late 90’s as Walmart and Target succeeded , many others failed, and that is in prosperity, wait till a recession hits, retailers will fall.
15. increased costs from transportation. head of USG said today, that of wallboard sold at HD, 15% of cost is transportation. I would imagine that BBBY goods have similar metric. Fuel costs and other commodity increases did not hit till post 8/31/05, yet cc still raised guidance. confusing.
16. lower margins due to new comp procedures, less options, leases?
the inventory turns of BBBY are around 2.5 – 2.7X. That is right at their historical average, maybe even slightly more. My gut tells me it is unsustainably low, yet history is showing different.
I would think that this would be one of the most important metrics.
I worked up some inventory turn numbers, since I had it, I figured I would share here. This is from AAII stock selector pro, most recent fiscal year. I included a bunch of retailers. some arent retailers, I put them, only because they are holdings of Berkshire Hathaway.
I find that BBBY turns of 2.7 is low. Yet, 2.7X is on the high side of their last five years or so. I just don’t get it, but I am guessing that I am wrong on the concern of mine.
Here are some Inventory Turn Calculations I worked up:
Inventory
| Q1 | Q2 | Q3 | Q4 | |
|---|---|---|---|---|
| 1998 | 342,525 | 401,749 | 360,337 | |
| 1999 | 415,076 | 439,535 | 522,433 | 470,433 |
| 2000 | 548,018 | 594,602 | 687,143 | 606,704 |
| 2001 | 696,896 | 733,157 | 849,238 | 753,972 |
| 2002 | 850,041 | 859,891 | 989,074 | 915,671 |
| 2003 | 926,906 | 958,778 | 1,167,808 | 1,012,334 |
| 2004 | 1,065,500 | 1,052,800 | 1,213,800 | 1,152,000 |
| 2005 | 1,239,000 | 1,238,900 |
Cost of Sales
| Q1 | Q2 | Q3 | Q4 | |
|---|---|---|---|---|
| 1998 | 203,003 | 214,958 | 243,719 | |
| 1999 | 213,158 | 272,016 | 289,673 | 336,263 |
| 2000 | 275,389 | 355,502 | 363,452 | 434,305 |
| 2001 | 340,874 | 422,294 | 448,408 | 508,820 |
| 2002 | 458,436 | 532,709 | 549,806 | 605,666 |
| 2003 | 526,688 | 652,300 | 687,753 | 734,576 |
| 2004 | 644,100 | 743,100 | 757,000 | 817,100 |
| 2005 | 723,600 | 829,400 |
Inventory Turns
| Q1 | Q2 | Q3 | Q4 | |
|---|---|---|---|---|
| 1998 | ? | ? | ? | 2.70 |
| 1999 | 2.30 | 2.34 | 2.35 | 2.41 |
| 2000 | 2.37 | 2.35 | 2.31 | 2.35 |
| 2001 | 2.31 | 2.29 | 2.28 | 2.27 |
| 2002 | 2.31 | 2.35 | 2.37 | 2.38 |
| 2003 | 2.40 | 2.46 | 2.49 | 2.56 |
| 2004 | 2.59 | 2.68 | 2.68 | 2.84 |
| 2005 | 2.61 | 2.67 |
Inventory turns of other companies
HD 5.1
WMT 7.8
BBBY 2.7
TGT 6.5
LOW 4.6
NKE 4.4
PIR 3.1
COST 12.1
GPS 5.6
ASD 7.0
RSTO 2.9
DLTR 3.5
AEOS 7.8
KSS 4.3BJ 9.0
April 7, 2004 Some Review notes
1. Starting to see some concern that new store productivity (NSP) is not going as well as hoped. This has hardly been confirmed and could be considered gossip and incorrect. BBBY warned analysts not to gauge NSP because of lumpiness of openings in current quarter and comp quarters. Concern seems to be that margins expanded on all levels, well beyond expectations, but Revenues did not expand as much.
2. CTS has a buying center in China. There has been “chatter” that BBBY will produce goods in China, such as bedding and linen, which could lower costs and increase margins. We question how that would affect a traditional retailer. Are they now a manufacturer ? If so, of course there are greater risks. What if China removes the peg to US Dollar. That would conceivably cause Chinese manufacturing to become more expensive. It has been our long term belief that China will eventually remove the peg to the USD, causing the Chinese currency to appreciate. If that were to happen, that would have a negative effect of cost savings for outsourcing companies. Again, much of this is unsubstantiated, and should not be relied upon as factual at all.
As a follow up to the above comment, I will mention that we read in Gary Shilling’s April 2004 insight, that they believe the eventual, but not immediate lifting of the Chinese currency, could cause a drop in her currency and not strength. Shilling mentions that the banks are shaky and lots of bad debts.
3. We are starting to see new sell side FC estimates for F2005 from $1.55 to $1.62, with mean being $1.57 (4/4/04), F2006 from $1.77 to $1.97, with mean being $1.85 (4/4/04). The high side of F2005 estimates is anticipating 20% eps growth. The F2006 est. of $1.97, which is the current highest estimate at this point is assuming operating margins of 15.7%. At this point we are skeptical that such margins will be generated.
March 30, 2004 Some pre-earnings release notes
1. Earnings to be released, after the bell on March 31, 2004. The following are some quick thoughts. Please understand that we do not give advice on this site. The following notes are merely “off the cuff opinions”. The following notes are some “casual views” and recent topics of discussion. Our current position (not recommendation !!!) is that of a short sale position with BBBY. That can change quickly and quietly. We are also balanced with our position, and one needs to know that our current BBBY position is just one of quite a few positions in a typical portfolio. If we exit a position, we will not necessarily post it on this site. This site should be looked at as merely one slight non authoritative source of BBBY research. Our analysis could be interpreted as wrong, biased and one sided. I write what I believe to be objective truth’s, but again, please do your own due diligence. With that said, here are some current pre earnings thoughts.
a. We have heard the argument that BBBY (41) is priced higher than the competition, because it is the leader of the industry, and the most efficient and profitable of the industry. We do not dispute that they are the “500 pound Gorilla” of the industry. With that said, we often mention that BBBY is a great company, great plan, great management. yet, the devils advocate in me says that Cisco and JDSU all could have said the same thing pre crash. Both companies were widely admired before March of 2000, but both have crashed in excess of 70% off of their highs (we are being generous with that performance).
comments in regards to Cisco in 1999 and BBBY today
1. Both companies have and had top notch management.
2. Both companies were at the hearts of wall street.
3. Both companies were flawless in quarterly execution.
4. Both companies consistently had upside surprises.
5. Both companies had heavy insider selling.
6. Both companies were priced ahead of their industry. Many believed price was warranted because of continued flawless execution.
7. Totally different industry and growth prospects. Cisco was hyper growth in an investment trendy industry. Yet, an incredibly important and disruptive industry. BBBY is hardly in a disruptive industry.
8. Cisco in 1999 was in the heart of the telecom build-out, which crashed. Yet, one could argue that BBBY is now in the heart of a consumer spending and potential real estate bubble. It is our opinion , that consumer spending patterns will retreat to levels, which will be discussed in college text books for scores of decades to come. We believe that the current US consumer is filled with debt, and we also believe that the consumerism of today, will go down in the economic history books in the future.
We can go on endlessly. We studied both companies. We find the greatest similarities in the ultimate perception as to why such frothy valuations were deserved. We subsequently found out that perhaps Cisco valuations pre crash, were not so deserved.
Of course, we could be wrong on BBBY. We certainly weren’t wrong on the telecom sector. We had discussions just like this with many during that period. There are chances and perhaps good chances that BBBY could execute in the industry , quickly and put their current valuation right at proper or undervalued levels. I could never have said that about Cisco back then. Nothing, I mean nothing could have given Cisco the opportunity to garner such lofty pre-crash valuations.
Please understand that we studied and continue to study the telecom industry. We lived through a true crash. Cisco is considered a big winner after the crash of 200 through 2002. She only crashed about 80% + off or her highs, whereas JDSU, Lucent , Corvis, Ciena, Avanex and Global Crossing to name just a few, crashed in excess of 95% from their highs of 99/00 to lows of 2002.
Many investors who are bullish on BBBY, comment that BBBY will have a future valuation contraction, but that the contraction is just too early. Using Lucent as an example. Lets assume the talk of “insane valuations” started at $30 per share. Then stock went to $80. Well, the stock bottomed out (so far) at around $0.70 per share. Hence, it wouldn’t have been early, but brilliant to exit at the $30.
Last comment, we repeat the following often. We respect BBBY. We wish the best for their operational future. We wish the best for their employees. We admire the management. We merely feel that Wall Street is rewarding them with an excessive and temporary high valuation.
b. Please look at the bottom of this page and read our comparisons of the industry and Home Depot in relation to valuation. You will see comments on May 20, 2003 and April 10, 2003.
What are our pre earnings thoughts prior to release on March 31, 2004 ?
We think reported earnings will be great, and wouldn’t be surprised to see them surpassing of most analysts estimates ($0.44). We would not be surprised to see quarterly earnings of greater than $0.45 per share. We expect strong numbers from Christmas Tree Shops (CTS). Yet, we would not be surprised to see the beginning signs of inventory bulge. We thing we will begin to see margin contraction via inflationary forces. We do not necessarily think this margin contraction will happen immediately, and it might not become evident for a few quarters. We think there is a possibility of some dividend or buyback talk. Buyback talk could affect the stock in a short term positive fashion. If there was a buyback of stock, we think it would ultimately be an attempt to divert the current massive dilution. As we mentioned previously, much of the dilution is being caused by the exercising of stock options by employees. We expect cash flows to be historically healthy. We think that cash flows will benefit from major options exercised during the quarter. It is important to understand that when an employee exercises an option, BBBY gets the cash from the exercise and they get a tax benefit from the IRS as well. Both of these occurrences have a positive impact on cash flow per share. Please keep in mind that BBBY is not buying back shares, to divert dilution. If BBBY stock price were to contract to a much lower level, it would be interesting to see if the company did aggressively buyback their own shares. This is a difficult concept for most casual investors to understand. Yet, dilution is a concern to all investors. The question becomes, is it better to incur dilution or to spend cash to divert dilution.
More Valuation thoughts
Don’t forget that the internal growth engine of BBBY has already showed signs of slowing. Double digit sales growth in excess of 20%, might look intact to the casual observer. One must keep in mind that sales growth has occurred via opening of new stores, purchase of Harmons and CTS. Remember, CTS is now valued at around 3X revenues, whereas BBBY bought CTS for 0.54X revenues. How does that sound, just for a name change. Hmmm, maybe they should consider changing their name to a “nanotech” type name 😉
Important to remember about BBBY and its growth engine. BBBY has doubled earnings per share every 3 years since it became a public company. In our opinion, that is about to end. Think about it. It is of our belief, and we think that most analysts and agencies, and BBBY would agree , that the doubling of earnings per share , every 3 years is about to end. Funny though, one sell side analyst has claimed in their report, that BBBY guided earnings per share to continue this trend. Our research and rereading of CC transcripts, is showing us (and we could be WRONG) that allegation to be incorrect.
In our opinion, there would be two positive effects of a severe contraction in Market price of BBBY. One would be the “reversion to the mean”. This means that if the price were more aligned with future growth, trends and macro economic events, even if that price was a severe correction from today’s price, it would ultimately be a healthier foundation for the company. A reduced stock price would be a great benefit for BBBY, as it could buy back shares at a more reasonable price. A buy back of shares is crucial to fight the dilution that is being created by employee stock options.
February 5, 2004 Notes on Prudential’s Upgrade
Prudential Securities issued an upgrade today for BBBY. They raised from neutral to overweight. Here are some notes I took from the report.
1. Concerned about new store productivity, and potential interest rate hikes, which could stall out housing market. Yet, despite their concerns, they feel the potential rewards of owning BBBY, are greater than the risks involved. Of course, as most of you know, we disagree. We are currently updating a report on BBBY and hope to post within the next week or so. Of course, my schedule may prevent that posting to ever happen.
2. Sites continued strength in housing market, they are surprised at the robustness of the housing market. Claims there is a 6 month lag from purchase to furnishing a home.
3. Claims comps over next few quarters will be easy. I need to look into that, as I can not recall from memory if that is accurate.
4. Feels BBBY is premier retailer in industry. We concur.
5. Sees room for margin expansion. We disagree with that over long term. We believe that competition and a soon to be retrenching consumer, who will focus on savings instead of spending, will bring down margins. Couple that with inflationary energy, paper and shipping costs, we think margins will drop, not to mention that stock options are not currently being included in the margins, but they will.
6. DCF analysis assumes 22 % increase in revenues for fiscal 2003, and then drops it to 10% in fiscal 2008. Expects gross margins to rise to 14.5% by F2008. they discount future cash flow at 12%, and then perform sensitivity analysis to arrive at $48 price target.
7. Mentions risks to be competition, interest rates, economy, consumer spending, high valuation multiples and housing market.
November 17, 2003
Scanning the November 14, 2004 Value Line and come up with some interesting comparatives. All ratios are forward looking ratios. You can see a page we have on these competitors by clicking here .
Company BBBY CPWM LIN
Price 40 41.50 27.75
Price/Sales 2.67 1.13 0.51
Price/earnings 32 26.77 16.32
Price/Book value 6.01 3.64 1.66
Gross Margin 43.6% 38.0% 43.0%
Operating Margin 16.0% 10.0% 7.5%
Net Profit Margin 8.5% 4.3% 3.2%
November 7, 2003
Here is some quick present value and future value analysis.
Right now, consensus HIGH side estimates are as follows
f2004***1.26
f2005***1.51
f2006***1.73
Using the above (and please remember that is high side of estimates) we get a growth rate of 19.84% from f2005 to f2004, and a 14.57% growth rate from f2005 to f2006. Notice the growth rate falling, this needs to be watched by all investors, especially those who invest in high growth….the key to investing in high growth is to find companies whose growth rate exceeds the p/e. Currently, I hardly think BBBY is of that stature.
The actual growth rate using PV analysis for the estimates above is 17.18%. Remember, remember, remember, that is the highest estimates out there right now.
Growth Rate 17.18 %
PV f2004 1.26
FV for 10 years at 17.18 % is 6.15 (meaning projected estimates for f2013)
If we use a P/E of 15 on the 2013 eps estimate of $6.15 we get $92.25 per share in year 2013.
Now, lets take the following:
Future Value year 10 *** 92.25 per share
Current Price **** 43.10
term *** 10 years
Annualized Return on investment using the highest scenario is 7.91% .
Lets now look at a lower 10 year growth rate, of a still healthy 10 %
Growth Rate 10.00 %
PV f2004 1.26
FV for 10 years at 10.0 % is 3.27 (meaning projected estimates for f2013)
If we use a P/E of 15 on the future eps est of $3.27 we get 49.05 per share.
Now, lets take the following:
Future Value year 10 *** 49.05 per share
Current Price **** 43.10
term *** 10 years
Annualized Return on investment using the highest scenario is 1.30% .
In summary, using givens above we get following returns on current price
10.00% growth rate 1.30% 10 year annualized returns
17.14 growth rate 1.30% 10 year annualized returns
Here is another way for me to look at it.
At what price would I consider a long investment in BBBY ?
Here is a method
current price is $43.10
I project growth rate at 10 % (believe it or not , i think it is too generous)
hence future value of BBBY is 49.05
I would like a 10% annualized return.
I put in my TI BAII Plus the following
1. adjust eps to once a year
2. future value 49.05
3. interest 10%
4. compute present value
this computes to current value of $18.91 per share.
Please let me know if I made an error in interpretation. Let me know if you need explanation. IMO, this is a money making opportunity….big time, on the short side, yet plenty of risk. Risk could include, leverage, estimates and earnings much greater than i project, possible
computational errors, buyouts, changed business plan…etc.etc.etc.. do your own research !!!!!
September 26, 2003
As we mentioned in our notes on September 26, 2003 , the company has doubled its earnings in every 3 year period since going public in 1992. That is an impressive statistic. I don’t think that will continue past F2004. F2001 eps was $0.74, hence the company would need $1.48 in eps for F2004, estimates are a touch higher than 1.48, hence it looks possible. F2002 eps was 1.00, personally I don’t think that eps will be 2.00 in F2005. Maybe the string will be broken. Interesting to see that the p/e is still at the high end of its range, although it looks as though earnings growth velocity is slowing.
I’m projecting F2007 eps at $2.28. Lets use $2.28 and give it various multiples
P/e*****Price
10******22.80
15******34.20
20******45.50
25******57.00
30******68.40
If this scenario were accurate, why would a company growing at 15% (previously 33% growth) be given a p/e greater than its growth rate. For argument sake, lets give it a p/e of 20 (too generous imo). Hence price in 5 years would be 45.50
current price of 40 being present value, using 5 years and future value of 45.50 , you get annual return on investment of 2.30%. My little brain says, if you are projecting 2.3% return, why not get a 5 year cd for 3.60% and eliminate the risk ?
Please don’t invest based solely on these notes or any other notes of ours. Please do your own due diligence and we are not responsible for updating our notes or for any material errors or misstatements.
August 6, 2003
1. same store comp sales are decreasing.
2. mortgage rates have spiked up, refinances have slowed materially. this will give less $$$ to consumer. see front page of today’s NYT.
3. prior annualized quarters of new store sales were between $181 to $205 per sq ft, whereas most recent quarter was $136. this seems unusually low.
4. company paid 0.54X revenues for “CTS” (which is good), yet now that purchase gets marked up to BBBY metric of near 3X revenues. Hence, there is a built in contradiction.
5. revenue growth is lagging square foot growth and same store sales. Perhaps new stores are less productive. perhaps smaller store concept is not as profitable as typical older store. perhaps new store locations are less desirable than traditional. Of course, the possibility exists that the new stores were opened later in the quarter which would cause an adverse metric, hence real important for longs (not shorts, since fundamental ratios are already frothy (i.e. p/s, p/e, etc).
6. most recent quarter had high margins. this should be watched for continuity. anything can happen in quarter or two.
7. Costco announces yesterday that employee benefit costs are hurting margins.
8. ROE, RONA (return on net assets) and ROIC have all decreased in last year. Still great numbers, but certainly a decrease.
June 6, 2003
We read this in a report on BBBY put out by Prudential. We don’t necessarily agree with the information..
“Risks And Valuation Of BBBY
The valuation methods we use to determine our price target are a price-to-earnings multiple and a
discounted cash flow (DCF) analysis. Our (12- to 18-month) $35 price target on Bed Bath & Beyond equates to 29 times our fiscal 2003 and 24 times our fiscal 2004 EPS estimate, translating into P/E/G ratios of 1.3 and 1.1, respectively. The P/E ratios remain well above the current average S&P 500 forward P/E ratio of 16.3x (P/E/G ratio of 1.4). We believe these above-average multiples are reasonable and fair, given that, in our opinion, BBBY is one of the premiere retailers in the country; however, we acknowledge that a shortfall in comp-store sales may cause the multiple to contract in the near term. In our five-year DCF analysis, we assume revenue grows 20% in fiscal 2003, and then gradually decreases as the company matures, to 10% in fiscal 2008, the final year of the analysis. We assume that gross margins will increase slightly, and operating margins will rise to 14.5% by FY’08. We discount future cash flow at 10% to compensate investors for risk, and then perform a sensitivity analysis on the final-year P/E multiple. Based on the above assumptions, we find that a final-year multiple of approximately 17 times BBBY’s estimated fiscal-year 2008 tax-adjusted operating profit yields a present value of approximately $35, which we believe is reasonable and fair. The risks that may impede achievement of this price target are: competition from numerous retailers, a downturn in the housing market, a decrease in consumer spending, the possible failure of management to correctly anticipate future home fashion trends, execution risk in the company’s nationwide expansion, and a relatively high price-to-earnings multiple if growth should stall.”
“In Conclusion…
While the housing market is not yet deteriorating, it does appear to be decelerating compared to last year, and with difficult year-over-year comparisons on the horizon in May and for the back-half of 2003, we remain cautious. Given the lag effect between the purchase of a home and its furnishing, difficult yearover- year comparisons in the housing market in 2003 lead us to believe that the housing tailwind, which helped home furnishings retailers in 2002, is currently turning neutral and may start to feel more like headwind later in 2003. We continue to believe that any short-fall in same-store sales results could result in multiple compression for both housewares retailers. In addition, we note that BBBY faces an extremely difficult comp-store sales comparisons this quarter.”
June 1, 2003
I was number crunching today. And trying to poke holes in my investment assumptions, targets , etc. Here are some values I came up with , all with various assumptions. I believe that scenarios 2 and 5 are most likely to happen. Of course just a quick opinion and most certainly subject to error and changing conditions.
Using Grahams intrinsic value of——>>> Price = eps * ((2* Growth rate)+8.5) * (4.4/30 year AAA bond rate)
1. 30 year AAA bond rate 5.05 %
growth rate 15 %
eps est 2004 1.20
eps est 2008 2.21
Intrinsic Value 2003 of 40
Intrinsic Value 2008 of 74
2. 30 year AAA bond rate 5.05 %
growth rate 10 %
eps est 2004 1.20
eps est 2008 1.93
Intrinsic Value 2003 of 30
Intrinsic Value 2008 of 48
3. 30 year AAA bond rate 5.05 %
growth rate 20 %
eps est 2004 1.20
eps est 2008 1.93
Intrinsic Value 2003 of 51
Intrinsic Value 2008 of 106
4. 30 year AAA bond rate 6.00 %
growth rate 15 %
eps est 2004 1.20
eps est 2008 2.21
Intrinsic Value 2003 of 40
Intrinsic Value 2008 of 74
5. 30 year AAA bond rate 6.00 %
growth rate 10 %
eps est 2004 1.20
eps est 2008 1.93
Intrinsic Value 2003 of 34
Intrinsic Value 2008 of 62
6. 30 year AAA bond rate 6.00 %
growth rate 20 %
eps est 2004 1.20
eps est 2008 1.93
Intrinsic Value 2003 of 43
Intrinsic Value 2008 of 89
May 28, 2003
A reader asks :
>> My previous comparison to HD was in the late eighties and early nineties. I was on the Prodigy boards back then and everyone was talking about high valuation levels… you know the rest.
<<
I was an investor in HD in 1992 and for a while after that. I was intrigued that the new store near me was packed all during the time we were in a recession. Hence I used a Peter Principle features/beatstreet.htm and looked at the company. I too was on Prodigy then and certainly remember the high multiple arguments. Here are the flaws I found in the nay sayers of the multiples of Home Depot. The P/E ratio was in the 40’s, yet, and a big YET, earnings were also growing at 40 %. You had revenues per share then of 2.70, eps of 0.13 with a stock price of 11. When you compare that to 1997 you see that Revenues were 11 per share (same as 1991/1992 stock price), eps was .52. Both eps and Revenues per share continued to grow at that pace through 2001. What happened to HD (keep in mind, I am not an expert). In the early 90’s, the little guys were put out of business by HD, for they were the only game in town. Now, we have Lowe’s, which will inevitably put pressure on HD. Hence you saw with HD a reversion to the mean of its valuation. whereas revenues in the early 90’s were 3X revenues, now they are 1X revenues. There were 214 stores in 1993 (see Value Line) and no real competition.
Now we have BBBY, in 1993 they had 48 stores (now they have 490). In 1993 hey traded at 3X revenues, they still do. Their avrerage PE in the early 90’s was in the low 30’s (today it is near 40). Gross margins and net margins are about 35 % higher for BBBY than HD (that is a BBBY positive when comparing valuations). Earnings and revenues were growing at a 29 % clip the last 10 years for BBBY, very similar to HD.
Now the question arises…. Is BBBY frothy ? In my view, YES, only because the multipliers are staying constant, whereas the revenue, profit and cash flow generation is not growing like it used too. Don’t get me wrong, 10 to 15 % growth is so healthy for the company (even mid to high single digit growth would be great for the operations). But, lower growth will not support an obese price (IMO) ….( he writes as his shorts are feeling very tight and uncomfortable as the price rises to the heavens as it whispers Amazing Grace along the way).
A Reader asks :
>> If you’re currently short BBBY I would be interested in knowing your positions and how your short positions have worked out for you. When I back test short positions I cannot get any of them to make money.
<<
with all due respect, the history is no way a predictor of the future. I was short the optics and telecom sector in the late 90’s early 00’s, hence the profits were nice and the losses were few. That is how I learned about Corvis, Ciena, Lucent , Cisco , FIBR and QQQ. Here are some postings as a resource
companies/cienaAnalysisof10-Kfor2000.html
all in all, my short positions have been profitable, but again, how could you not make money when the NAZ drops 75 % off of its highs and you were short ?
May 20, 2003
Metric***HD 30***BBBY***39
1.price/sales*******1.13***2.73
2.Dividend yield****0.85***nil
3.p/e trailing***17.99***37.0
4.p/e forward****19.50***33.3
5.price/book*******3.25***6.50
6.P/cash flow forward***12**26.67
7.gross margin***32.5***43.6
8.operating margin***11.5***15.5
9.net profit margin***6.1***8.4
10.ROE***17.50***20.00
11.growth rate***19 %***24
What do we see in the above?
We see that BBBY has higher margins. Their margins are > than HD’s by 37 * (net margin). Hence, one could argue that they deserve a higher multiple than HD.
Lets assign various multiples to the metrics and see what BBBY’s price would be if that multiple were reached.
1. Price to sales. Let’s use 1.60X sales. Hence BBBY price would be 24.17
2. Forward P/E, lets use 26 (higher than the growth rate). Hence BBBY price would be 39. Interesting, no room for error.
3. Price to cash flow, let’s us 16.50. Hence BBBY price would be 24.75.
4. Price to book, lets us 4.50. Hence BBBY price would be 27.68.
All of the above scenarios were using projected forward numbers for F2003. No room for error, and the numbers I used are what I consider to be overly generous.
May 7, 2003
Notes from UBS report dated 5/1/03
We initiated coverage of Bed Bath & Beyond with a Neutral 1 rating and a 12-
month price target of $42. Our $42 price target is based on 29 times our 2004
EPS estimate of $1.44. This reflects roughly a 60% premium over the market
multiple, which is in line with historical levels.
We believe Bed Bath & Beyond is the best retailer in our coverage universe. It
combines a superb customer and merchandising driven management team with a
only a small share of its core market and a competitive scenario that, in our view,
is more attractive than any other major sector in our coverage. With its focus on
market share gains and growth, it is the company most reminiscent of the glory
days of growth for the category killers in the 1990s. Unfortunately, it shares one
other common characteristic with those, a multiple that assumes no slowdown for
a long time, one that leaves little room for near-term error. Despite the positives,
we see better risk/reward opportunities in other stocks in this sector, and we are
initiating coverage of Bed Bath & Beyond with a Neutral 1 rating.
Bed Bath & Beyond is one of those few retailers that combine a small share of
its core market with excellent management and merchandising. While this is the
type of retailer that an investor might build a growth portfolio around, valuation
has to be taken into consideration. BBBY is nearly 200% of the S&P 500
multiple, not expensive if one looks out five years and discounts cash flows but
it is trading with no room for error. We would recommend that investors keep
watch for when the value is more appealing. We rate BBBY Neutral 1.
The $85 billion Home Products sector, in our view, is the most attractive in our
coverage. Neither of the major players have more than a 10% share of the
market, expansion is reasonable, Wal-Mart is less of a competitive factor, and
department stores have over 20% of the market. As important, spending on
home products fits perfectly into the UBS demographic scenario of an aging
consumer spending more on durables for the home.
In our opinion, Bed Bath & Beyond’s strength starts with its management team.
One of the concerns over Bed Bath & Beyond over the years has been what will
happen when the founders, Warren Eisenberg and Len Feinstein, pull back or
retire, how will this company operate? Those watching the company could have
easily answered that question by seeing the emergence of a superb group of
senior managers just below those two. Most important to the effort has been
Steve Temares, who this month added the CEO title to his president and COO
positions. By following the principles laid down by the two founders, a focus on
customer satisfaction, some of the best and most unique merchandising in
retailing, and a culture driven to succeed, Steve has not only kept the growth
going but has been president for the best stretch of earnings since Bed, Bath &
Beyond became a public company.
What we find most positive about the company is that it is never satisfied. Wal-
Mart’s year-in year-out success is partly due to the recognition by that excellent
management team that it could have done it better. BBBY has that same
approach. Besides Mr. Temares, there are other senior members of management
that know that Kohl’s is growing in the business, that Wal-Mart will get better
every year, that Linens has new merchandising talent, that Penney is improving,
and that Target is a major player and growth company in home products. For
example, Art Stark, Bed Bath & Beyond’s chief merchandising officer and senior
vice president is constantly visiting the competition, looking for what they are
doing better than Bed Bath & Beyond, how can Bed Bath & Beyond differentiate
its look to capture more customers, and why did some items not work.
A visit to some of the newer stores highlights the constant reinvestment. The
relatively new store in Totowa, New Jersey, includes a fine China display to test
that business, a high-end packaged food offering from Harry and David’s, and the
integration of a Harmon cosmetics and drug section to the left of the store. Some
ideas will work, some won’t, but constantly testing is what provides growth.
That’s the good news. The problem for us is very simple. The secret is out. This
stock trades at the highest multiple for any brick-and-mortar retailer. The risk in
those situations is that the company slips one quarter, because of weather, a
fashion mistake (not likely due to the diversity of product and limited fashion
risk), or some other unforeseen error. In our opinion, at its current valuation, the
risk/reward is not favorable enough to have a Buy recommendation on the stock.
Bed Bath & Beyond Financial Outlook
Bed Bath & Beyond recently reported its fourth quarter for 2002, finishing off
an excellent year. In 2002, EPS grew 35% to $1.00, well above the low 20s
projected growth rate. That was driven by comparable store sales of 7.9%, in a
difficult retail market and came against a strong 7.1% the year before. Square
footage grew 17.2% in 2002 in the Bed and Beyond stores, with the company
adding 95 stores to end the year with 490 stores. It also bought Harmon discount
cosmetics chain, which operates 29 stores but it is only about 1% of total square
footage.
We expect earnings to grow over 20% in 2003 but are using the company’s
guidance of 20% growth to $1.20 in our current estimates. Square footage
growth will moderate somewhat from 2002’s levels with about 85-90 stores
likely to open, representing about a 12% increase in square footage. Given the
maturation of the new store base from 2002, we see top-line growth in the midto
high teens and some margin expansion to achieve the 20% growth rate. Over
time, the margin expansion is likely to slow down and investors should think of
this company as more of a high teen’s grower given its moderating square
footage growth.
Ironically, one of the bigger issues facing the company at this time is its strong
positive cash flow. Despite the large number of stores added, cash grew by $283
million to $765 million at the end of 2002. That is over four times the projected
cap ex in 2003, a cap ex that should be covered by cash flow on its own. Over
time, keeping the cash on the books will lower the return on investment for this
superior company, which could impact the stock price. High-class problem.
May 2, 2003
reasons EPS may shrink
said these all before :
1. competition increasing . Restoration hardware, Federated new concepts, Linen and things, Williams Sonoma.
2. housing starting to cool (see my WSJ post on 5/1/03)
3. unemployment rising – less money to spend on non essentials
4. focus on savings for colleges and retirement. make do with what you have mentality.
dont think i ever mentioned these.
1. rising health care costs.
2. rising fuel costs.
3. rising workers comp costs.
4. rising prices of commodities, may have gm % pull down.
5. potential excess inventories reducing gross margin.
6. weak dollar and most of BBBY’s inventory is imported.
May 1, 2003
>> It use to take 3 1/2 weeks to open a store now it takes less than a week in most cases! Think of the money their saving<<
Interesting metric. That seems so quick. Nevertheless, they most certainly are an efficient, well managed and excellent organization.
>> as i said to Big Al in post 7731 “despite a large number of stores opened in the last year… cash grew by $238 million to $765 million by the end of 2002. that’s 4 times the cash required for cap ex spending in 2003! in fact cap ex should be covered by cash flow on its own… <<
I think you posted the wrong post number. which one were you referring to ? Interesting, they do have a ton of cash ( about 19 % of annual projected f2004 revenues). There balance sheet and financials from what I see appear flawless. Heck, look at their turns, gross and operating margins, revenue per sq foot, etc etc. all are world class.
>> so why, with no debt do they float a convert??? <<
I have seen no proof of a convert in the works. I have seen no analyst report as such either. I have read nothing other than a rumor of such. Rumors are generally BS, if you have seen reference to a convert, please clue us in.
But, lets hypothetically explore your question.
>> so why, with no debt do they float a convert??? <<
First of all , if you read the S&P upgrade from yesterday, you will see a form of debt in a non traditional sense, but most certainly an obligation.
>> Although BBBY
has no funded debt outstanding, lease adjusted debt is substantial at
about $1.6 billion, resulting in total debt to capital of about 53%.
However, the company has maintained a strong and growing level of cash,
$750 million at year-end 2002.<<
Secondly, notice that S&P upgraded from BBB- to BBB. They write ” Despite its good financial profile, the lack of a committed credit
facility somewhat limits BBBY’s financial flexibility. As a result,
Standard & Poor’s expects the company to maintain substantial cash
position to fund working capital and fixed capital needs.”
This link will give you the definition of BBB
http://www.alcol.org/ratinglistS&P.pdf
>> BBB
An obligation rated ‘BBB’ exhibits adequate
protection parameters. However, adverse
economic conditions or changing circumstances
are more likely to lead to a weakened
capacity of the obligor to meet its
financial commitment on the obligation.
commitment on the obligation.<<
Why would BBBY float a convert rather than outright debt. One factor might be the interest costs for debt. Since they are not A rated, the costs to borrow might be greater. Another reason could be that BBBY is a trendy play, and via a convert , they could get cheap quick money. Heck , CIENA (CIEN) did it at its peak, and Lucent did it from good times till bad. So many reasons for converts, but they aren’t always shareholder friendly. Very often the convert buyers will protect their investment with “puts”, hence putting downward pressure on the stock. Of course it would be too premature to discuss dilution, as it would be all up to the convert itself.
This year BBBY projects to open 82 – 90 stores in fiscal ’03, previous guidance was 88 stores and before that, guidance was 95 stores. Here is the kicker. This will be the first time in over a decade that they will open less stores than the previous year.
Prudential on BBBY April 1ish 2003
>> BBBY: EPS GAINS DRIVEN BY COMP-STORE SALES AND SG&A IMPROVEMENT; BUT
DIFFICULT COMPARISONS ARE AROUND THE CORNER<<
>> We continue to believe that, on a fundamental basis, Bed Bath & Beyond is the premiere retailer in
the hardline sector. However, the housing market clearly decelerated in the first two months of the
year, and BBBY’s comp-store sales have also decelerated from the strong results reported last year.
In addition, BBBY faces an extremely difficult year-over-year comp in 1Q’03, and, in our view,
should comp-store sales fall short of expectations, the market would punish BBBY.
· We believe the current valuation, coupled with high comp-store sales expectations, leaves investors
vulnerable, and that near-term downside risk outweighs upside potential.<<
April 29, 2003
Merrill Lynch upgrade
>> We are raising our 12-month price objective on Bed Bath & Beyond to $48 from $40
reflecting our expectations for continued healthy sales and earnings growth despite a
difficult external environment. Our $48 price objective represents a valuation of 33 times
our 2004 estimate of $1.46, slightly below its 5 year average forward multiple of 35 times.
We believe this premium multiple is justified based on Bed Bath’s proven ability to
consistently meet or exceed sales and earnings targets offering some opportunity for upside.<<
April 10, 2003
Some price to book stuff
price to book ratios for various years
date***ratio***book value per share
1996***7.69***.78
1997***7.25***1.07
1998***8.91***1.47
1999***8.16***1.99
2000***6.74***2.84
2001***7.23***3.76
2002***7.58***4.82
Comparing Specialty Retail Industry with similar ratios we get the following :
Store***Price/book val (bv)***bv***
ANF***3.11***09.55*** price to book was at its high in 1999 when it was 16.7:1
AEOS**1.66***10.15*** price to book was at its high in 1999 when it was 10.3:1
LIN***1.38***16.85*** price to book was at its high in 1999 when it was 05.4:1
PIR***1.87***8.70*** price to book was at its high in 1998 when it was 5:1
WSM***3.30***6.90*** price to book is at its high right now
HD****2.00***10.25** price to book was at its high in 1998 when it was 10:1
MIK***1.51***17.05** price to book was at its high in 2002 when it was 3.4:1
If BBBY had a price to book of 2.0, the price would need to adjust to 12.30 per share, assuming a 6.15 book at f2003 (march 1, 2004).
price to sales ratios for various years
date***ratio***sales per share
1996***2.00***3.00
1997***2.00***3.86
1998***2.61***5.01
1999***2.43***6.69
2000***2.30***8.32
2001***2.70***10.05
2002***2.65***12.17
If we extrapolate fiscal year 2003 projections, using the current price of 37.18 and potential revenues of 4,355.6 M, with fully diluted shares O/S projected of 302.4 M, we get sales per share of 14.40. The price to sales would calculate to 2.58.
The above would account for no let down in number of stores opening, same store comps, housing industry stability, etc etc.
Gross Margins for same periods have remained relatively stable in the area of 43 %.
Operating margins have increased from 12.60 % in 1996 to 13.10 % in YE March 2003.
Comparing Specialty Retail Industry with similar margins we get the following :
Store***Price/Sales***GM***Operating margin
ANF***1.68***44.5***22.5 , price to sales was at its high in 1999 before ANF dropped in half
AEOS**0.75***39.2***13.5, price to sales was at its high in 2001 before it dropped in half
LIN***0.50***43.0***07.5, price to sales was at its high in 1999 before it dropped in half
PIR***0.75***42.8***14.2, price to sales was at its high in 1998 before it dropped in half
WSM***0.95***44.0***12.7, price to sales was at its high in 1999 before it dropped in half
HD****0.75***33.0***11.7, price to sales was at its high in 1999 before ANF dropped in half
Home Depot in 1999 had a price to sales of 4.12 as an example.
Disclaimer
If you are a client of ours, and if you have questions regarding Bed, Bath and Beyond, please call our office. If you are not a client of Redfield, Blonsky & Co. LLC Investment Management Division and are reading these notes, we urge you to do your own research. We will not be responsible for any person making an investment decision based on these notes. these notes are a “by-product” of our research. We are not responsible for the accuracy of these notes. We are not responsible for errors that may occur in these notes. Please do not rely on us to monitor or update this or any other report we may issue. In theory, we could come across some type of data or idea, which causes us to eliminate our short position of Bed, Bath and Beyond from our portfolios. We will not notify readers revisions to these notes. We are not responsible to keep readers of these notes updated for changes or material errors or for any reason whatsoever. We manage portfolios for clients, and those clients are our greatest concern as it relates to investing. Certain clients of Redfield, Blonsky & Co LLC may not have Bed, Bath and Beyond in their portfolios. There could be various reasons for this. Again, if you would like to discuss Bed, Bath and Beyond, please contact Ronald R. Redfield, CPA, PFS (partner in charge of investment management division).
Information herein is believed to be reliable, but its accuracy and completeness cannot be guaranteed. Opinions, estimates, and projections constitute our judgment and are subject to change without notice. This publication is provided to you for information purposes only and is not intended as an offer or solicitation. Redfield, Blonsky & Co. LLC and Ronald R Redfield, CPA, PFS, may hold a position or act as an advisor on any investments mentioned in a report or discussion.